Mcebisi Qabaqaba
University of Fort Hare – MSc
It contains some of the most extensive and well-exposed sequences of rocks from the supercontinent Gondwanaland, which formed about 600-million years ago. It is also home to fossils of ancient reptiles that died millions of years ago. But the exact rock distribution of the Balfour Formation, which extends from Graaff Reinet in the west and East London in the east, remains poorly understood.
This is a problem – to mine, protect, or study South Africa’s natural resources and ores, we first need to know what is there. But the country is a large place, so it is not possible to do this manually and accurately. So, scientists are working to identify the composition of the different rocks, known as lithology – from space.
It looks like an unremarkable rock from a distance: a mottled grey with veins of white. But from the sunlight that it reflects or absorbs, it is possible to tell what kind of rock it is. All rocks have their own unique signature, a characteristic way that sunlight bounces off them.
Researchers in South Africa are working to create a library of these unique fingerprints, known as spectral signatures, so that they have a reference from which to map the country’s geology. There is currently no definitive library of our rocks’ unique light signatures, and large tracts of South Africa such as the Balfour Formation in Eastern Cape province remain uncharacterised.
A spectral library would provide a quick, less expensive way of mapping that is not constrained by issues such as, in the case of mountain slopes, whether a person can physically get to an area.
It is possible to get a rock’s light signature manually: You go into the field, collect rock samples, measure their spectra – either in the field or in the lab using a spectrometer, which is a handheld instrument capable of measuring how light reflects off rock – and store it in a spectral library. But it isn’t possible to do this across entire mountain ranges. For one thing, many of the sites are inaccessible. For another, it is time- and money-consuming, requiring a large number of people.
But once you have a rock’s light signature, you can identify other examples of that type of rock from space. When mapping, you import the spectral library, which contains these rock fingerprints, into remote sensing software, together with satellite imagery. The software (my research used software called ERDAS IMAGINE) compares spectra from the library to the spectra picked up in satellite imagery. In the case of the Balfour Formation, we are using images from the European Space Agency’s Sentinel 2A satellite.
While there are international libraries containing rock and mineral spectral fingerprints, you cannot simply use information about another country’s rocks for South Africa’s. This is because our rocks have slightly different physical properties. The manner in which a rock crystallises determines its spectral signature, as does the area’s rainfall and temperature. Its surroundings also play an important role: is the rock in a forest or a desert? All these things can influence a rock’s spectral signature.
Besides, the spectral signatures for most rocks within Southern Africa are unknown.
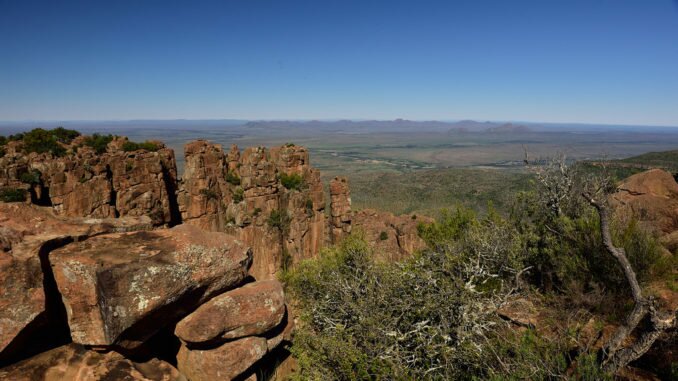
My research focuses on the Balfour Formation, an understudied geological site in the Eastern Cape. This formation is predominantly a grey-green sandstone. However, it also contains some mudstone, a fine-grained rock that ranges in colour from khaki through to red. The Balfour Formation’s black shale rock, with its abundant organic matter trapped in the rock, is often home to ancient fossils. The dolerite rock was once hot lava that covered Gondwanaland and occurs in the Balfour Formation as dykes and sills, meaning it cuts across sandstone and mudstone rock materials.
But there is more to mapping a formation than simply plugging figures into a computer program. The spectral signature of the same rock in the same location can be different. The outer surface of a rock – whether it is weathered or fresh – plays a major role in determining the spectral signature. For example, the spectral signature of two samples of sandstone from the same area should be the same, but if one sample has a coarse grain and the other a fine one, then their light signatures will differ. Also, if one contains water, which changes its colour, it will have a slightly different spectral fingerprint to a sample that contains less water.
The fact that spectral signatures of the same rock type can be different, stresses the need for South Africa to have a library for its own rocks. If spectra of the same rock differ, even when they come from the same location, it is impossible to take spectra from a library in Canada or the United States, and apply it to the South African context.
My study will provide a valuable database that researchers, companies and the government can use as a standard reference for future research in mapping the distributions of different rock types for geological applications. Geological companies can use the methods that will be honed during my study to better identify minerals and ore within South Africa. And eventually we will know and understand the indigenous rock beneath our feet, and the actual lay of the land.

Leave a Reply